Sunday, August 26, 2012

Card Trick

I plan to use this activity in class on the first day. Besides being an interesting challenge, I think it can be used to the show the power and magic of mathematics. It is also a great way to introduce problem solving and different problem solving strategies including draw a picture or diagram, look for a pattern, logical reasoning, work backwards and PERSEVERANCE.
Prepare thirteen playing cards, all the same suit. Then place the cards in a specific order so that when you flip over every other card you will reveal the cards in descending order. More specifically, when you flip over the top card it will be a King, and then the next card is placed at the bottom of the pile still face down.  The next card flipped over is a queen, and then the next card is placed at the bottom of the pile, etc. This process repeats until you have revealed all the cards in order from King to Ace.
When you show this trick it seems deceptively easy and students jump in and think they have it right away. Then the fun begins! When they "run through" the deck the first time, the pattern usually works up to 7, but then breaks down after that because they didn't take into account that some of the cards would come to the top of the deck multiple times. It is exciting to watch students struggle with this problem, try different strategies, get more feedback directly from the cards, and then try again.
I plan to show this trick towards the end of class on the first day and let students try to solve the problem. I am hoping some students will go home and work on it at home and then show how they solved it in class the next day.


I plan to show the students how to solve this problem by drawing a diagram.


____ ____ ____ ____ ____ ____ ____ ____ ____ ____ ____ ____ ____

Using this diagram we can fill in the cards that need to be in each position. You simply write in the K, skip a line, Q, skip a line, etc. Then when you reach the end, start over and continue to skip a blank line each time.

This is a great activity for math class, but I think it could also be used effectively in other classes or advisory groups.

Sunday, August 19, 2012

Math Anxiety

#msSunFun There are two books I read this summer that were very interesting and helped me form a set of goals for the coming school year:  Learning to Love Math:  Teaching Strategies That Change Student Attitudes and Get Results by Judy Willis and Accessible Mathematics:  10 Instructional Shifts That Raise Student Achievement by Steven Leinwand

        
In the first book the author discusses the importance of reversing negative attitudes about math as a critical step toward learning. "If your students are anxious during math class, information entering their brains is less likely to reach the conscious thinking and long-term memory parts of the prefrontal cortex, and learning will not take place. . . . Under stressful conditions, emotion is dominant over cognition, and the rational-thinking PFC has limited influence on behavior, focus, memory, and problem solving" (pg. 10). The book gives lots of suggestions for helping students overcome math anxiety and learn to love math. One of my goals this year is to give special attention and focus to any student who has struggled with math in the past and exhibits math anxiety when they come to math class. For example, one thing that has bothered me in the past is returning tests and quizzes to students with low scores with a big ugly stamp on the front requesting a parent signature. It feels like adding insult to injury when the student hurriedly turns the test over on their desk or hides it in their binder.


This year I want to do things differently.  If I feel like I need to make the parent aware of the test or quiz score, I am going to send an e-mail. (Note: all grades are available to view by students and parents on our school grading software.) But more importantly I am going to request a short individual conference with the student to discuss the grade and together form a plan for improvement. Hopefully these individual conversations will help me understand whatever is preventing the student from mastering the material and will help me make adjustments throughout the year.

I like all the ideas in the second book. I am going to try to do all 10 of the instructional shifts mentioned in the book. Here is a copy of the list from the front cover of the book:

1) Incorporate ongoing cumulative review into every day's lesson
2) Adapt what we know works in our reading programs and apply it to mathematics instruction (focus on explanations and don't stop with one word or numerical answers to problems).
3) Use multiple representations of mathematical entities.
4) Create language-rich classroom routines.
5) Take every available opportunity to support the development of number sense.
6) Build from graphs, charts, and tables.
7) Tie the math to such questions as: "How big?" "How much?" "How far?" to increase the natural use of measurment throught the curriculum.
8) Minimize what is no longer important.

9) Embed the mathematics in realistic problems and real-world contexts.
10) Make "Why?" "How do you know?" "Can you explain?" classroom mantras.

One idea I have for working on these instructional shifts is to make a poster for each unit covered in class. These posters will include vocabulary and key concepts and will highlight the most important information covered in class and included in the interactive student notebooks. I have some wall space around the room that is very high and difficult to reach. I am planning to bring a small ladder to school so that after we finish each unit I can hang the posters so that they form a border at the top of the wall around the room. Hopefully these posters will be a continual reminder of what we have covered so far and how much they have learned!


Monday, August 13, 2012

Active vs. Passive Learning

I read The Teaching Gap several years ago and was very intrigued by the differences between typical instruction in U. S. and Japan classrooms. I was especially interested in the different approaches taken to problem solving. In Japan "the teacher presents a problem to the students without first demonstrating how to solve the problem." Whereas in the U. S. "the teacher almost always demonstrates a procedure for solving problems before assigning them to students" (pg. 77).

I have tried from time to time to give my students a "challenge" and then, using the work produced by students working on their own or in small groups, teach the lesson. I have found some success with this approach, but I have also noticed some deep-seated resistance to this method among my students. That resistance has taken the form of giving up, wasting time, complaining and most worrisome believing that they will learn more effectively if I just explain to them how to do it.

When I was reading the book I frequently thought, I wonder what a classroom that follows these teaching methods looks like? How does it start? How long do students spend working on a problem? What do student explanations look like? How do the students work in small groups? How does it end? etc. I was really interested when I saw a blogpost recently about the TIMSS video study and included some short clips and some analysis. (I don't recall the author of the post, and would appreciate it if anyone can provide the link.) When I was searching for the post later I discovered that 53 of the TIMSS public use videos have been translated and are available on TIMSSvideo.com.

I watched two different videos on the same topic and compared the different approaches taken by the teachers. My plan during the first week of school is to show some very short clips from both videos to my students and ask them to compare the two different teaching methods.

From the Japanese lesson on finding missing angle measurements I want to show:
00:00 - 00:15 Opening bell and bowing
4:45 - 5:30 Student explains the first method of three presented on how to solve review problem
10:15 - 12:00 Teacher explains the new task to students:  write a new problem with certain conditions
23:30 - 24:00 Students get into groups to compare problems and choose one for class to solve
32:00 - 33:00 Teacher takes one problem from each group to copy on the board for all students to solve.
51:00 - 51:25 Teacher ends class

From the U. S. lesson on finding missing angle measurements I want to show:
00:00 - 1:15 Opening and review
15:00-17:00 New set of problems is presented
21:10-22:00 Teacher works with individual student
27:30 - 30:00 Teacher ends independent work and discusses problems with class
30:30 - 31:30 Teacher reviews integer rules
44:45 Teacher ends class
48:00 Teacher dismisses class

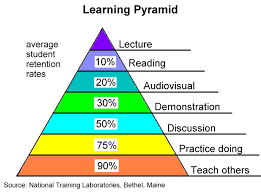
After watching the videos and discussing the differences, I would like to do an experiment with my students. I will divide them into three groups. One group will turn around and face the back wall and only be able to hear. One group will be able to hear and see and the third group will hear, see and copy what is given. I will read (and show) 20 mathematical terms. After a short break (I will do something completely different here), I will ask students to write down how many words they can remember from the list that was given. We will compare the number of words that students can remember from the three different groups. It will be interesting to see if the percentage of words remembered is close to the percentages shown in the Learning Pyramid shown below. Note: I know there has been some doubt about the accuracy of the percentages in the pyramid and whether they are supported by actual research. This model was presented and used as the foundation of a education graduate course I took called Curriculum and Practice in School Environments. I am concerned about using inaccurate information, but I think research strongly supports the idea that active teaching methods are more effective than passive teaching methods and I think this graphic conveys that concept very well. I plan to have the students fill out a blank graphic of the pyramid of learning and retention for their interactive notebooks.


I am hoping that by showing these videos and talking about the differences between passive and active learning that my students will understand why I might ask them to struggle with a problem before I simply show them how to solve it. I want them to know that struggling with a challenging problem is not bad, in fact it is probably the most effective way to learn new material and develop problem solving skills. I am hoping that by explaining the value of this teaching method at the beginning of the year that my students will buy into the idea and that my attempts to use this method will be more successful.

Wednesday, August 8, 2012

Who wants to be a Millionaire?

I am starting my 5th year of teaching this fall. Last year I wanted to focus on student motivation and so I made a bulletin board with this title "Who wants to be a Millionaire?" and I decorated it with play money from various board games from home. On the second day of school I played the music to the game show "Who Want to be a Millionaire?" as the students walked in the room. Then I showed the students some data of average lifetime earnings at different levels of educational attainment. I found the data from a report published by The Georgetown University Center on Education and the Workforce. A bar chart in the report shows that the median lifetime earnings of a student with no high school diploma is $973,000 and $2,268,000 for a student who earns a bachelor's degree. After discussing the information in the chart, I asked the students what is the total value of their education. After determining that a college degree is worth more than a million dollars ($1,295,000), I wanted to break this down into something that would make sense to middle school students so I guided them through a series of calculations to determine the value of their education per year, per day, per hour and per class period.  We used these facts in our calculations: 12 years of education from secondary school (including 5th grade) to college education, 180 school days, 6 hours of school each day (excluding lunch) and 8 class periods per day. The results were truly astounding. Students found that if they graduate from college on average their education will be worth $107,917 per year, $600 per day, $100 per hour and $75 per class period.

Last year I used the $100 per hour theme throughout the year by giving out $100 bill pencils for prizes for student of the month and for other student achievements and exceptional effort. And I often reminded the students that by giving their best effort in class they are earning $100 per hour in future earnings. This year I plan to extend that by putting $100 bill stickers in students' notebooks and writing them notes recognizing their efforts in class.


Important Note: As an economics major in college I learned about opportunity costs and that is definitely what I tried to focus on during this discussion of money and earnings. I tried to emphasize to the students that money has value in the sense that it represents opportunities.