Sunday, February 18, 2018

Percent Exploration Stations!

When possible, I like to design an exploration activity for the first day of each new unit. The purpose of these explorations is to help students activate their prior knowledge about the topic and also help them build on that prior knowledge with hands on and engaging activities. Below are the instructions for the seven stations that I came up with for our next unit on percent. Here is the link to the document I created for students to record their work at each station: Percent Exploration Stations


1. Basketball:  Shoot a basketball ten times.
    a) How many times did you make the basket?
    b) What percent of your shots did you make?
    c) What percent of your shots did you miss?


2. Percent Fail:  Look at the posters and explain why the percents used in three of the posters are incorrect. Link to the hundreds of Mail Fail images


3. Pom Pom Draw:  Without looking in the bag, randomly select 10 colored pom poms from the bag and record your results. Replace the pom poms in the bag each time before you select another pom pom (with replacement).
                                                     Red                                  Blue

    a) What fraction of the pom poms that you selected are red?
    b) What fraction of the pom poms that you selected are blue?
    c) What percent of the pom poms that you selected are red?
    d)What percent of the pom poms that you selected are blue?

Now take out all of the pom poms from the bag.
    e) What percent of all the pom poms are red?
    f)  What percent of all the pom poms are blue?
    g) Are the percents in c) and e) the same? Why or why not?


4. Go Fish:  Play Go Fish with your partner. You are trying to get sets of four cards where each set has a fraction, decimal, percent and area model that all the the same value. Record below the sets that both you and your partner find during the game. If you found the set, write your initials in that row in the table below.


5. Percent Guesser:
Use the link posted on Google Classroom to practice finding the amount represented by each given percent. See how close you can get to the exact value. Record your guesses, actual values and the how close you got to the actual percent below and circle your best guess!


6. Tarsia Puzzle:  Work with your partner to put together the triangle pieces to form a hexagon. Find equal values on the sides of two triangles and place them together. Here is the link to the creators of this Tarsia puzzle and free downloads.


7. Desmos Card Sort:  Fractions, Decimals, and Percents:  Go to student.desmos.com and type in the class code:
Drag the cards that the same value together to make sets--each set has four cards.


Thursday, December 28, 2017

Pass to Leave Class Tear Off Sheet

I think I finally have a workable system for allowing students to leave class for emergencies, while at the same time rewarding students who do not use "leaving class" as an excuse to get out of doing work. When students leave class for a drink of water, etc., they often miss 10-20% of the class period, which over time can have a huge negative impact on learning for students who leave class frequently. In addition, when students leave class they often miss important instructions or information and then need to ask the teacher or other students to explain what they missed when they return, which can also negatively impact the learning for all the other students in the classroom.
I like the idea of a ticket system whereby students can use tickets to leave class when necessary and can also get rewards for unused tickets at the end of each quarter. In the past I have set up this system with students only to have it fall apart at the beginning of the second quarter when I did not have a new set of tickets to hand out and/or did not give students the opportunity to redeem unused tickets.
This year I gave students a tear off sheet for the entire school year that they taped into the back of their math journal. Math journals are required every day and are stored in the classroom, hence students should have ready access to these tickets at all times. There are twelve tickets in total--three for each marking period. I think this is a reasonable amount for the entire school year if students are leaving class only for emergencies.


Instructions on Tear Off Sheet:

"Our math class is very short and our time to learn together is precious. Please use passing time or lunchtime to use the restroom or water fountain or get supplies from your locker. I understand that sometimes there are emergencies and so please save these "tickets" for those circumstances (three per marking period). Please keep this sheet in your math journal so that is available whenever you need to leave the room. After asking for permission to leave the room, tear out one "ticket" and place it in the piggy bank at the sign out table where you must also record your name, destination and time before you leave the room. Any unused "tickets" can be redeemed for 𝝅 Dollars at the end of each marking period (up to three per marking period)."

In general students have been very cooperative about this system. When students ask to leave class, I usually ask if it is an emergency and then give permission if necessary, reminding them to "use a ticket." For me this is finally a sustainable low maintenance classroom management system that also reduces the number of requests to leave class and the loss of classroom instructional time.

Here is a link to the document:  Pass to Leave Class Tear Off Sheet Blog Version

Wednesday, November 15, 2017

Two Types of Division


I am teaching dividing fractions now and wanted to be clear in my own mind about the differences between these two ways of thinking about and describing division problems. I have found myself switching between these two different ways of describing division problems and I really did not understand why. I made the graphic below to help me understand why some problems make more sense with partitive division (sharing) and others with quotative division (measurement). And how the language used to describe a problem changes how you would draw a picture of the problem (model) and the meaning of the quotient.


Partitive Division

  • Sharing Division
  • I know the number of groups
  • How many in each group?


Quotative Division

  • Measurement Division
  • I know how much will be in each group
  • How many groups?


I find quotative division (measurement division) very helpful when describing fraction division problems. For example, how many 1/2s are in 10 wholes? However, partitive division (sharing division) makes more sense when the dividend is a fraction or mixed number and the divisor is a whole number. For example, 4  3/5 lbs of candy is divided among 6 friends. How much candy does each friend get?

This video helped me understand the difference between these two different ways of thinking about division problems.

Saturday, September 16, 2017

Factors and Multiples Puzzle from NRICH


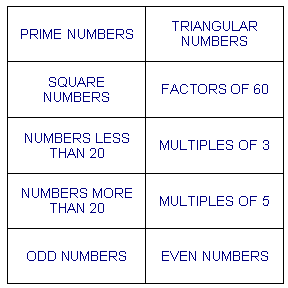
This Factors and Multiples Puzzle from NRICH was a perfect way to start the school year with my sixth grade students. It is one of the best low threshold high ceiling tasks I've used and creates opportunities for students to work together and discuss numbers and sets of numbers while they review essential vocabulary in the context of an interesting challenge.

Here are some things that I did the day before we worked on the puzzle that I think helped students get started right away and work on the puzzle for the entire class period.

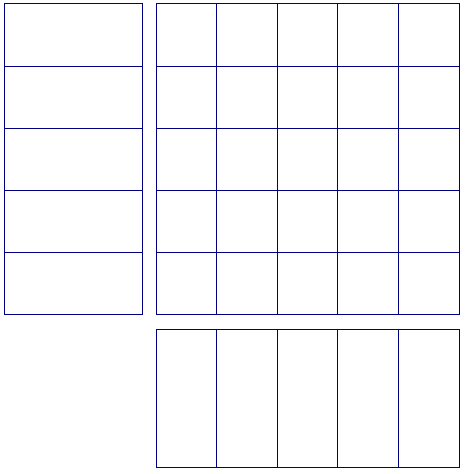
1) I did notice and wonder with square numbers and triangular numbers using these graphics which I recreated based on inspiration from this poster


2) I did some mini-challenges where students, using small whiteboards, wrote down as many numbers as they could think of that meet two conditions. Students loved this!

  • Think of numbers that are Odd and Prime
  • Think of numbers that are Even and Multiples of 5
  • Think of numbers that are Less than 20 and Factors of 60
  • Think of numbers that are Square Numbers and Multiples of 3
  • Think of numbers that are More than 20 and Triangular Numbers
  • Think of numbers that are Prime and Square Numbers

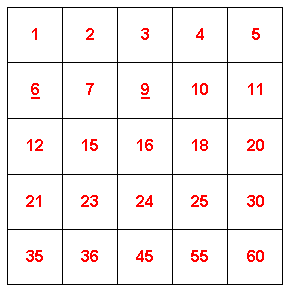
3) I think this is a very good activity for partners. I copied half of the heading cards and number cards on a different color of copy paper so that two sets of partners working at the same table would not mix up their cards. 

4) It was very easy for the students to accidentally disturb some or all of their pieces which caused some frustration. Next year I plan to enlarge the puzzle and copy on card stock and/or laminate. Several different colors of heading and number cards would also be helpful.

5) When partners believed that they had completed the puzzle correctly, I asked another partnership to look at their puzzle to see if they could find any errors. This on the fly extension helped push the ceiling even higher for early finishers.


board

heading cards
number cards

Here are some photographs of completed puzzles from my classes. There is at least one error on each of these puzzles and I am thinking I could use these photos next year to help introduce the activity and/or use as an extension.


This is a very cool chart that one of my students created on her own to help her logically and methodically determine where heading cards and number cards could or could not be placed in order to solve the puzzle.


And here is a link to some correct solutions to the puzzle posted on the NRICH website.

Sunday, August 20, 2017

Student Survey Questions: Middle School Edition

Surveys are a great way for students to practice collecting data and then making sense of that data by create a graph to display the data and finding the measures of central tendency. Here is a list of survey questions that are appropriate and engaging for middle school students. Please share any ideas you have for survey questions and data displays and analysis in the comments!

Here is a link to the document I created for this project. The survey questions below are included in the document for student to select from or get examples in order to write their own survey question.
Data and Statistics Project

1) How many pets do you have?
2) What time did you go to bed last night?
3) How many hours of sleep did you get last night? (round to the nearest 1/2 hour)
4) How many letters are in your first and last name?
5) How many books have you read this school year?
6) How many siblings do you have? (include half-siblings and step brothers and sisters)
7) How many movies did you watch in the theater last month?
8) How many times did you buy your lunch at school last week?
9) What time did you wake up last Saturday morning?
10) How many glasses of milk do you drink daily?
11) What is your shoe size?
12) How many states have you visited?
13) How many texts do you send a day?
14) How many pieces of candy to you eat on Halloween?
15) If I gave you 34 hot wings right now, how many would you eat?
16) How many times a week do you do chores?
17) How many times a week do you eat fast food?
18) How many digits of pi do you know?
19) How many times do you watch TV in a week?
20) How much money do you spend when you go to town?
21) How many pairs of shoes do you have?
22) What is your height?
23) How long does it take you to get ready in the morning? (in minutes)
24) How many times a day do you brush your teeth?
25) How many times a week do you go shopping?
26) How many hours of sports do you play in a week?
27) How many minutes do you spend a night on your homework?
28) What time do you get up in the morning?
29) How many times have you been to a different country?
30) How many people do you consider to be your closest friends?
31) How much money would you need to be given to drink sour milk?
32) How many sports do you play?
33) Flip a water bottle 10 times, how many times does it land upright?
34) How many types of soda do you drink?
35) Write your own


I got some ideas for survey questions from f(t) here:

Sunday, May 21, 2017

Area of Polygons Discovery Lesson on Dot Paper

I created these pictures to give my students the opportunity to explore the areas of triangles, parallelograms and trapezoids in reference to the area of rectangles. I made copies of these two slides from my lesson presentation for the students to write on and they explored the areas of the shapes by drawing on the dot paper, counting square units, cutting off parts of the polygons and moving them to different places, and making conjectures about how the areas of the figures were related and why. This was a very engaging activity and the students used many different strategies to find the areas of these figures and these explorations formed the foundation for understanding the formulas for finding the areas of these figures. I was very pleased to see that students continued to use ideas from these pictorial models to help them with areas of polygons that were not displayed on dot paper (for example, triangle from left side of parallelogram is moved to the right side to form a rectangle with the same area).


The students had lots of interesting ideas for finding the area of Triangle F. I was amazed and thrilled when several students, connected the area of the obtuse triangle to the area of a paralleogram, instead of a rectangle, which was much easier for students in the class to see.


I use this slide to summarize the exploration. I highlighted part of each of the formulas in red to help students see the connection between all of the formulas:  base x height. Even the formula for trapezoid can be understood in this way if we talk about finding the average base x height.


 Here is a link to the google presentation, Area of Polygons Exploration, that contains these slides and some others I used to discuss and summarize the formulas.

Thursday, February 9, 2017

Cliff Jumping and Absolute Value

I love to show this video of Laso Schaller's world record jump of 58.8 meters in Maggia, Switzerland.
I use it when we start our unit on absolute value and it sparks a nice discussion about the distance above and below zero. I show the video and then ask the students what they would want to know before they jumped off the cliff. They usually come up with some very interesting comments including how deep the water is and how far down you will go after you hit the water. Using these questions I guide the discussion towards the total distance traveled by drawing a diagram on the board with a vertical number line showing positive numbers above zero and negative numbers below zero. I use 192 ft (58.8 m) for the top of the cliff and -48 ft. for the depth of the water needed for the jump. I got these numbers by using the following information about the depth of water needed for a safe jump based on the height of the jump.


(Depending on time constraints, I could leave off the numeric expression and ask the students to figure out what the depth of the water must be for this jump.)

This discussion helps provide the mathematical motivation for absolute value and why positive numbers remain positive and negative numbers become positive when we are measuring distance. And then at this point I offer the mathematical notation and definition of absolute value.

Here are some still shots from the video:


The video replays the jump several times and shows different angles and information with each replay. For some of the replays, additional information about the jump overlays the video including the height of the top of the cliff as it is compared to the Leaning Tower of Pisa and also a time lapse of the speed and time of the Laso Schaller throughout the jump.